Inside Connecterra - February 2025
Learn about the latest feature releases and improvements in the Connecterra Platform and how to use them
Exciting updates to help you get more from your farm’s data! This month, we’re introducing new Pen Density Insights and an easy way to see cow counts behind your data, giving you better clarity and control over your decisions.
Optimize stocking density with a data-driven approach
What's new
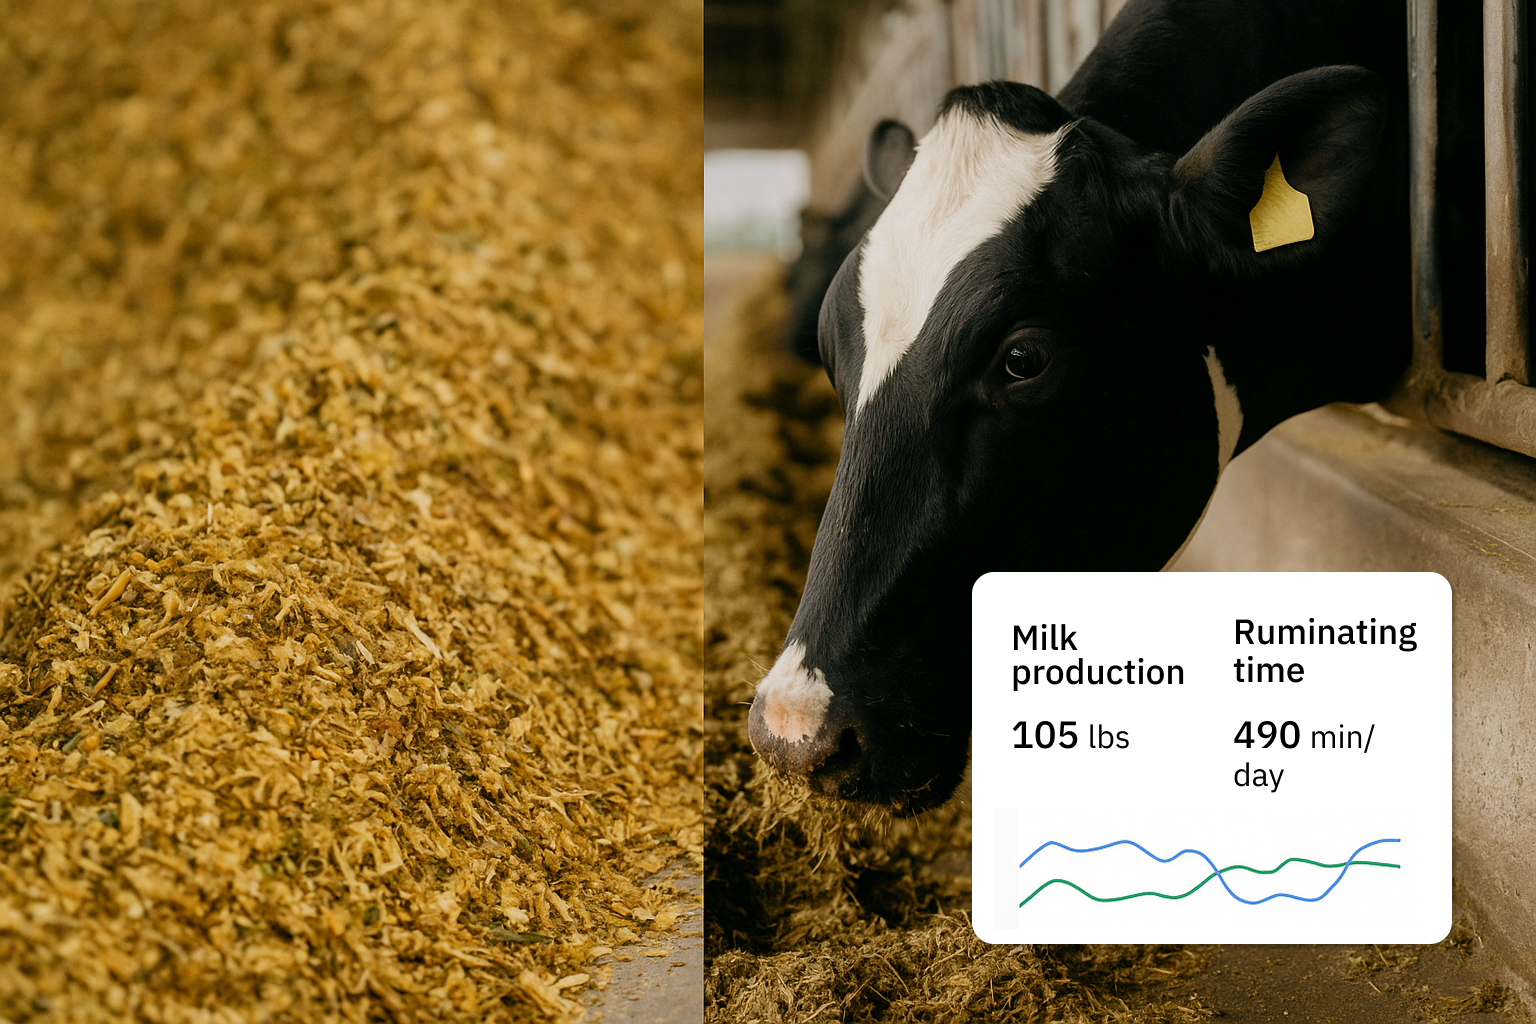
The new insights help you evaluate how cow numbers per pen impact milk production, dry matter intake and feed efficiency.
Why it's important
The impact of overcrowding can vary considerably depending on your barn, pen structure, and other factors. We're introducing a data-driven approach to finding the optimal stocking density for your farm. This helps you to make informed decisions on grouping, culling, and maximizing efficiency.
How it works
We analyze your metrics for significant variation across different stocking densities. If performance drops as cow numbers increase, it might be time to adjust stocking density. If the trend line stays steady, you know your current setup is working, and you may be able to explore increased stocking potential.
*Note that these insights are available to farms that have been integrated on the Connecterra Platform for at least 6 months and have a minimum of 40 cows per pen.
See cow numbers for more context on chart data
What's new
You’ll now see a pop-up displaying the number of cows that specific data points are based on.
Why it's important
Data can fluctuate due to changes in group size. This update helps you better interpret trends by showing exactly how many cows contributed to a given metric.
How it works
Simply hover over a point on any (Production or Behavior) chart, and a small popup will display the corresponding cow count. This makes it easier to understand shifts in performance.